Develop a model to describe that matter is made of particles too small to be seen.
 Piper Computer Kit
 Sensor Explorer Kit
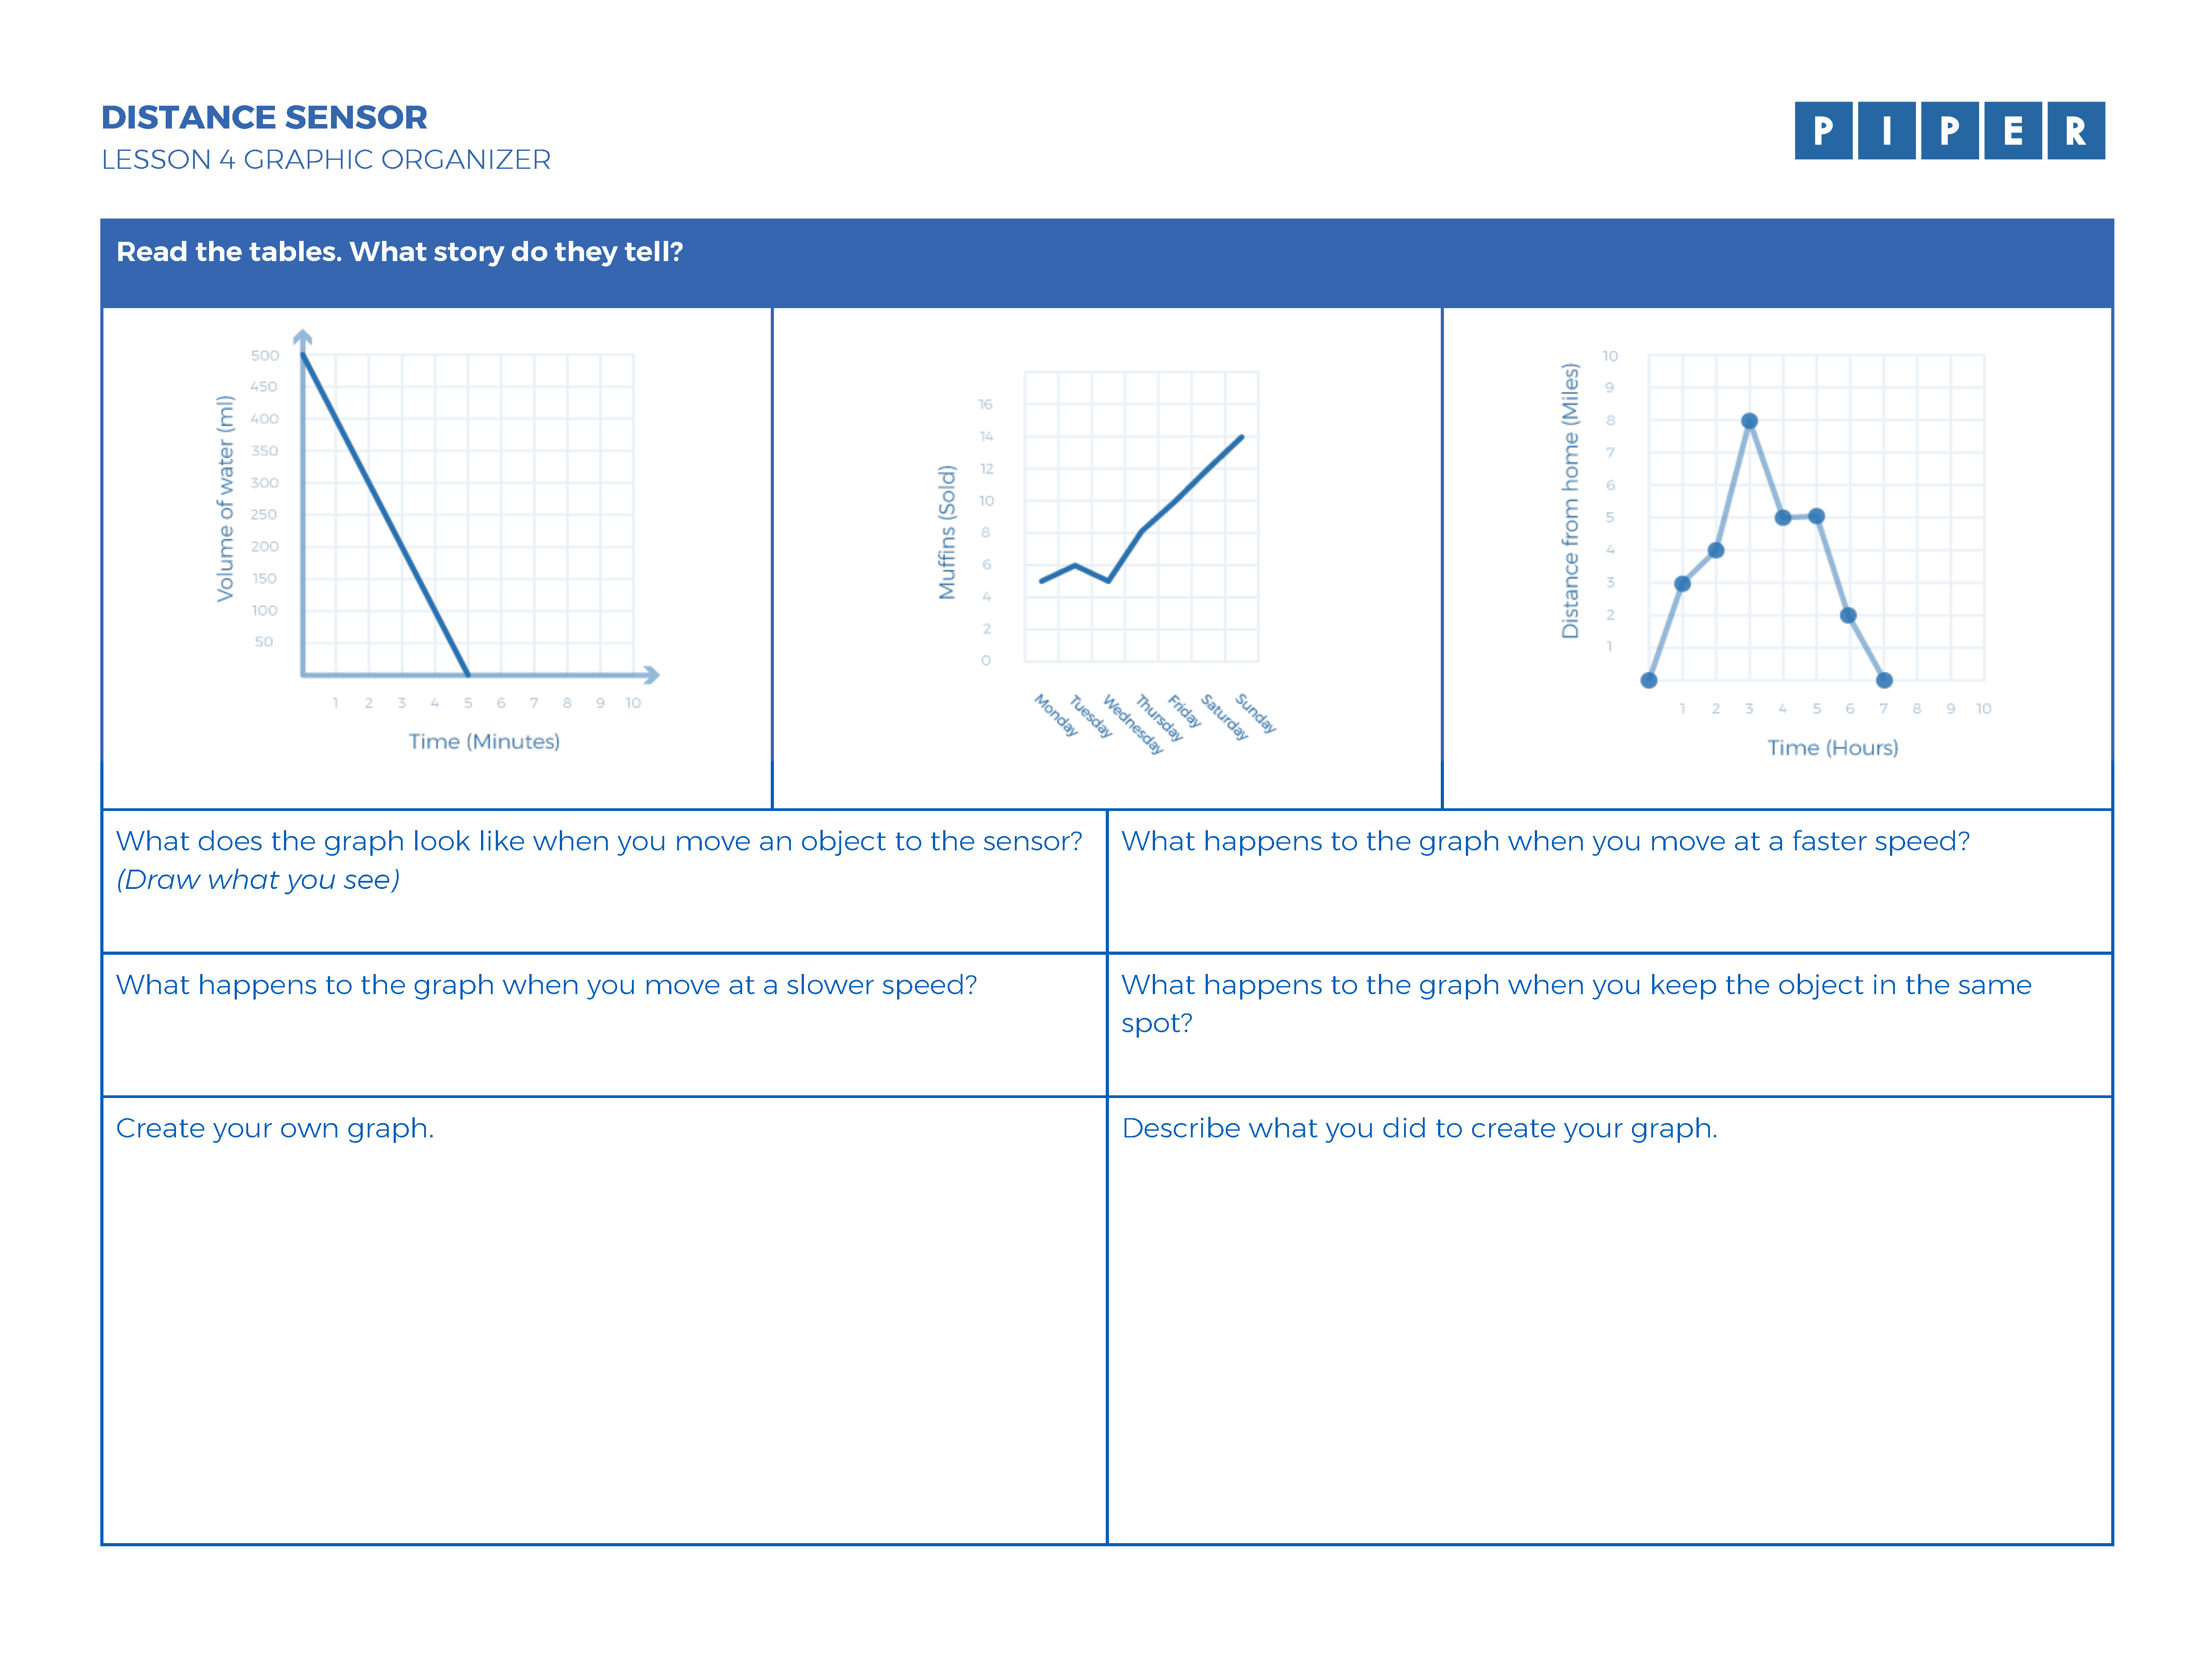
Use slides 2-4 in the Lesson 4 Slide Deck to discuss the stories created for each graph. Students are provided the graphs in their graphic organizers.
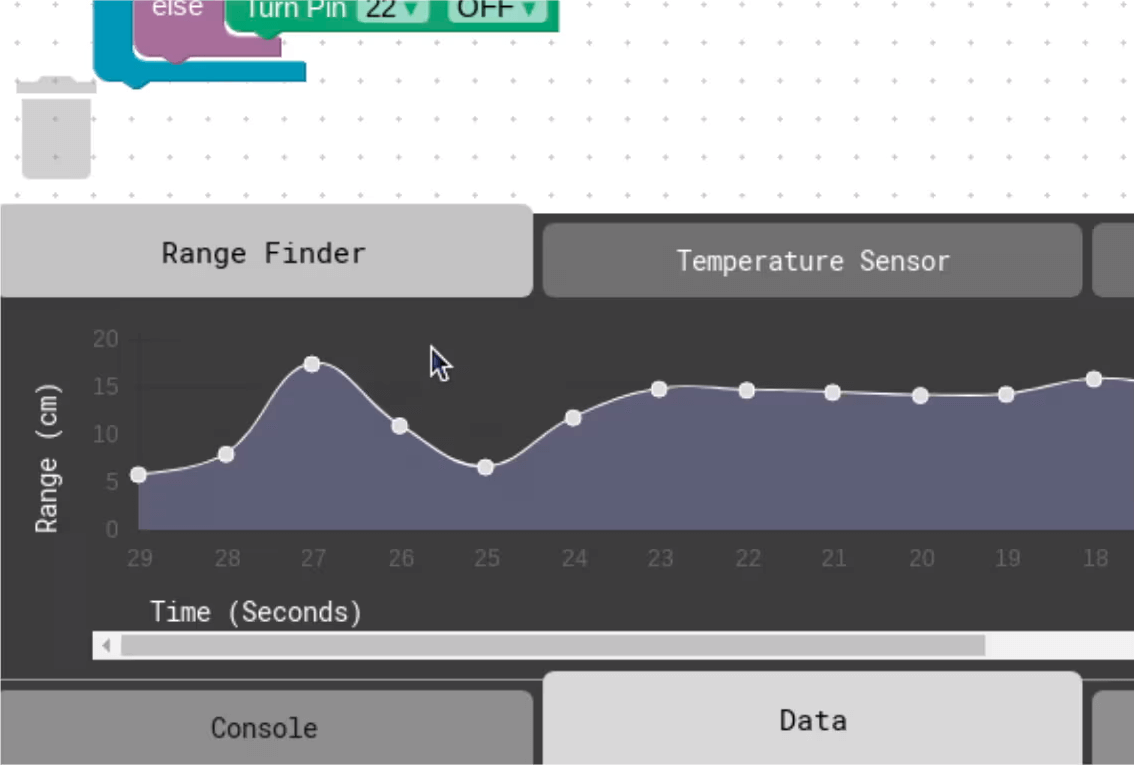
Students will explore how to read graphs by creating their own in PiperCode. Guided directions and space for recording observations can be found in the Graphic Organizer.
Use slide 5 to review the different graphs created by each group. Participating groups can try to describe the motion displayed by the data.
Alternate activity: have groups share their graphs and have the other groups try to create an explanation of the movement shown.Provide students with graphs that show different speeds. Slides 6 - 8 describe the different types of slopes and how to calculate for speed using the slope.
At the end of this lesson, have student take the Assessment.
 Security/Fire System Installers: Salary $50,130/yr
 Civil Engineer: Salary $88,050/yr
 Construction Manager: Salary $101,480/yr
 Avionics Technicians: Salary $75,450/yr
 DOWNLOAD
Frequency How many waves pass a point in one second. It’s like counting how many peaks of a wave move by in a specific amount of time. Higher frequency means more waves are passing by each second, which can make the waves carry more information, while lower frequency means fewer waves are passing by each second.
Prediction An educated guess about what might happen in the future based on what you know or have observed. In science, predictions are often made before conducting experiments to see if the results match what was expected.
Absorption When a material takes in light instead of reflecting it. In color sensors, absorption helps determine what color something is by measuring how much light is absorbed by different colors. For example, if a sensor shines light on an object and the object absorbs a lot of red light, the sensor can tell that the object is red.
We are excited to be aligned with the following standards.
| Concept | Standard |
|
Develop a model to describe that matter is made of particles too small to be seen. |
3-5-PS1-1 |
|
Make observations and/or measurements of an object’s motion to provide evidence that a pattern can be used to predict future motion. |
3-PS2-2 |
|
Develop a model of waves to describe patterns in terms of amplitude and wavelength and that waves can cause objects to move. |
4-PS4-1 |
|
Develop a model to describe that light reflecting from objects and entering the eye allows objects to be seen. |
4-PS4-2 |
|
Generate and compare multiple solutions that use patterns to transfer information. |
4-PS4-3 |
|
Use a model to describe that animals receive different types of information through their senses, process the information in their brain, and respond to the information in different ways. |
4-LS1-2 |
|
Develop a model to describe the cycling of matter and flow of energy among living and nonliving parts of an ecosystem. |
MS-LS2-3 |
|
Develop a model that predicts and describes changes in particle motion, temperature, and state of a pure substance when thermal energy is added or removed. |
MS-PS1-4 |
|
Plan an investigation to determine the relationships among the energy transferred, the type of matter, the mass, and the change in the average kinetic energy of the particles as measured by the temperature of the sample. |
MS-PS3-4 |
|
Construct, use, and present arguments to support the claim that when the kinetic energy of an object changes, energy is transferred to or from the object. |
MS-PS3-5 |
|
Develop a model to describe that waves are reflected, absorbed, or transmitted through various materials. |
MS-PS4-2 |
|
Develop a model to describe the cycling of water through Earth's systems driven by energy from the sun and the force of gravity. |
MS-ESS2-4 |
|
Ask questions to clarify evidence of the factors that have caused the rise in global temperatures over the past century. |
MS-ESS3-5 |
|
Obtain and combine information to describe climates in different regions of the world. |
3-ESS2-2 |